

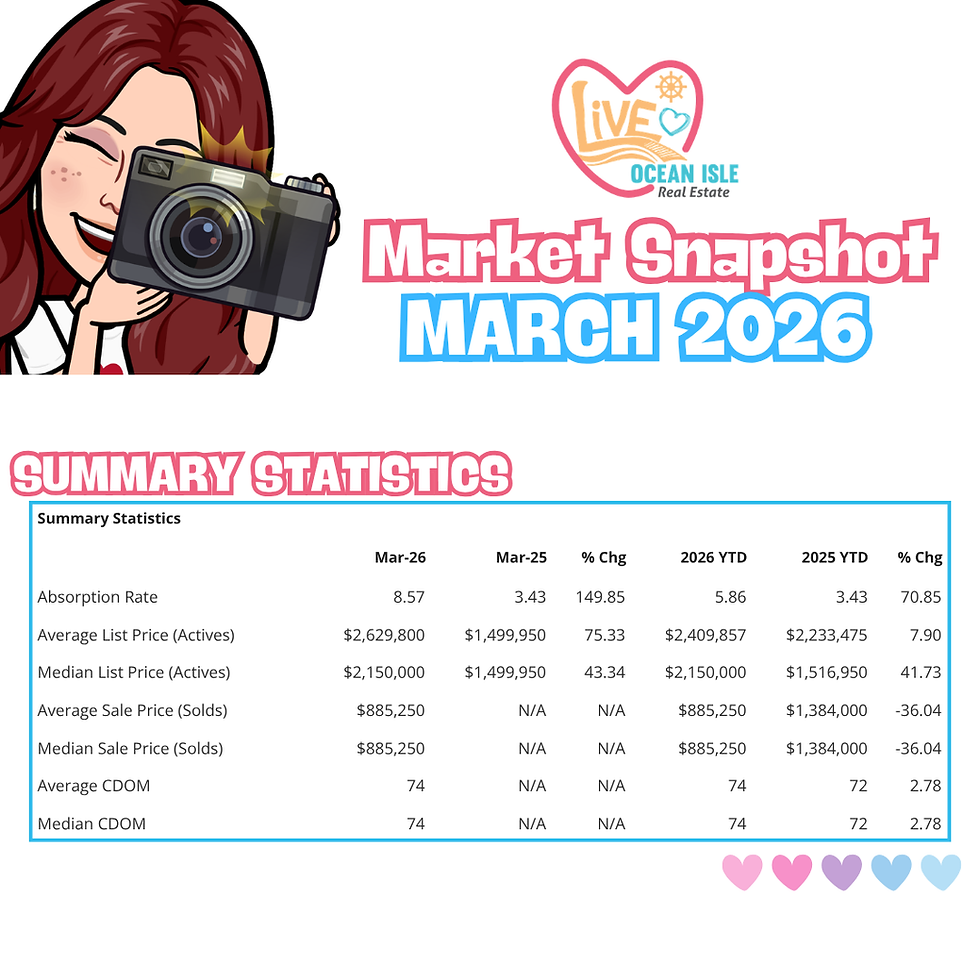
Ocean Isle Beach Market Snapshot 📸 April 2026
- Jessica Wainwright

- May 18
- 4 min read

Ocean Isle Beach Real Estate Market Update (April 2026):
More Inventory, Fewer Pendings & What It Means for Buyers and Sellers 🌊🏡📊
If you’ve been watching the Ocean Isle Beach, NC real estate market, April 2026 brought a big shift in momentum: more homes for sale, more closed sales, and far fewer pending listings—a sign that buyers are shopping carefully and sellers need to be strategic to stand out.
Whether you’re searching Ocean Isle Beach homes for sale, considering a second home at Ocean Isle Beach, or wondering what your Ocean Isle Beach home is worth, here’s a clear breakdown of the latest Ocean Isle Beach market statistics for April 2026 and what they mean right now. 😊
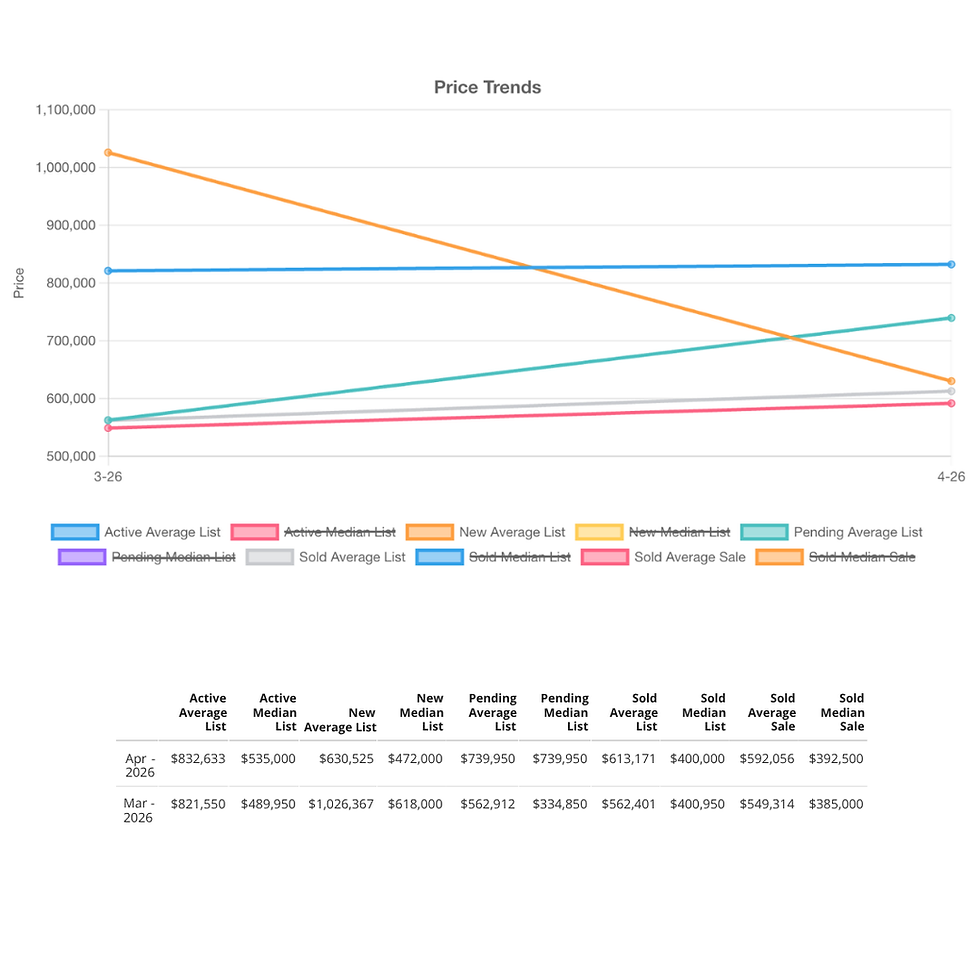
Ocean Isle Beach Price Trends (April 2026) 💰🏖️
Here’s how pricing shifted from March → April:
Active & New Listing Prices
Active average list price: $832,633 (up from $821,550)
Active median list price: $535,000 (up from $489,950)
New average list price: $630,525 (down from $1,026,367)
New median list price: $472,000 (down from $618,000)
Pending Prices
Pending average list price: $739,950 (up from $562,912)
Pending median list price: $739,950 (up from $334,850)
Sold Prices
Sold average list price: $613,171 (up from $562,401)
Sold median list price: $400,000 (about flat vs $400,950)
Sold average sale price: $592,056 (up from $549,314)
Sold median sale price: $392,500 (up from $385,000)
What this means:
Active pricing rose, and sold prices increased modestly—suggesting continued demand. New listing prices dropped significantly month-over-month, which can indicate more mid-range inventory entering the market (or fewer luxury listings compared to March).
Pending pricing jumped, which may reflect that the few homes going under contract in April were higher-priced properties.
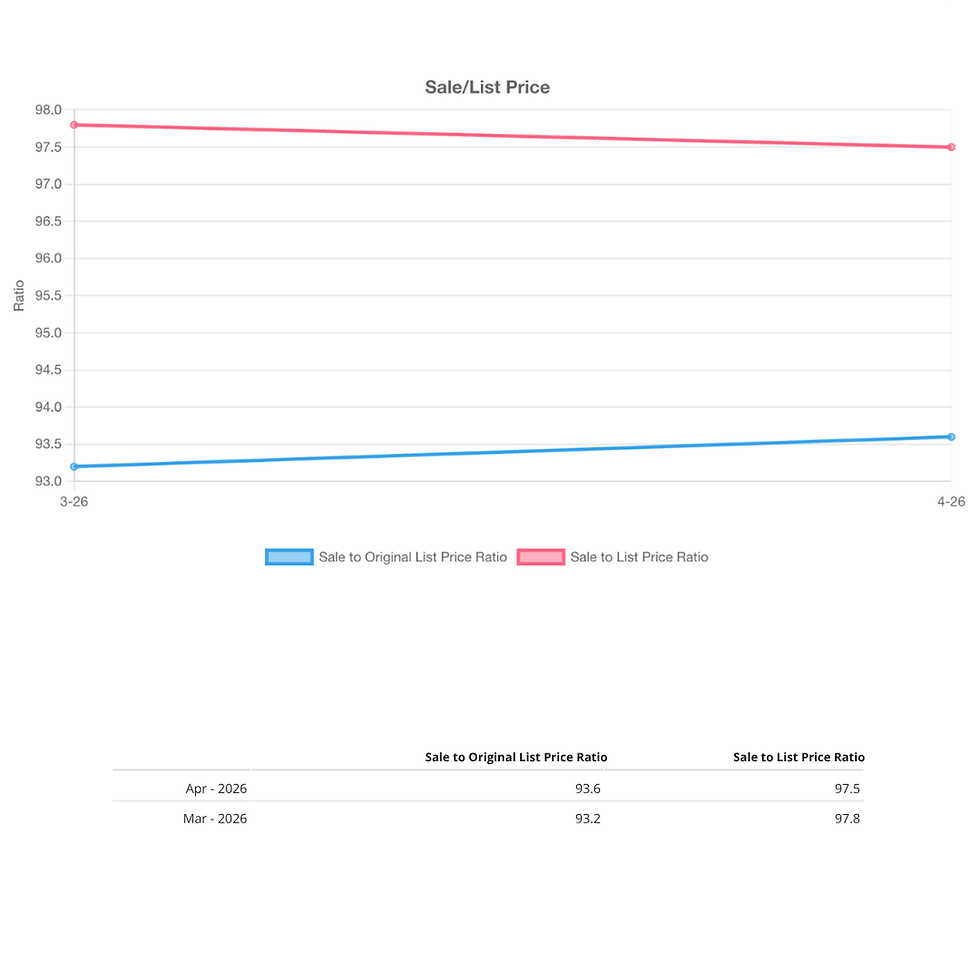
Are Homes Selling Close to Asking Price in Ocean Isle Beach? ✅
Sale-to-original list price ratio: 93.6% (up from 93.2%)
Sale-to-list price ratio: 97.5% (down slightly from 97.8%)
What this means:
Sellers are still closing close to list price overall, but the gap between original list and final sale suggests that price reductions and strategic adjustments are playing a bigger role before homes go under contract.
Number of listings: Inventory Up, Pendings Down 🏡🏡🏡
Active listings: 183 (up from 142)
New listings: 65 (up from 62)
Pending listings: 2 (down from 50)
Sold listings: 54 (up from 50)
What this means:
Buyers have more options in the Ocean Isle Beach housing market, but pending sales dropped sharply—often a sign that buyers are being more selective, negotiating more, or taking longer to commit (especially in a coastal market where condition, HOA rules, insurance, and rental potential matter).
At the same time, sold listings increased, which tells us homes are still closing—especially the ones that are priced right and show well.

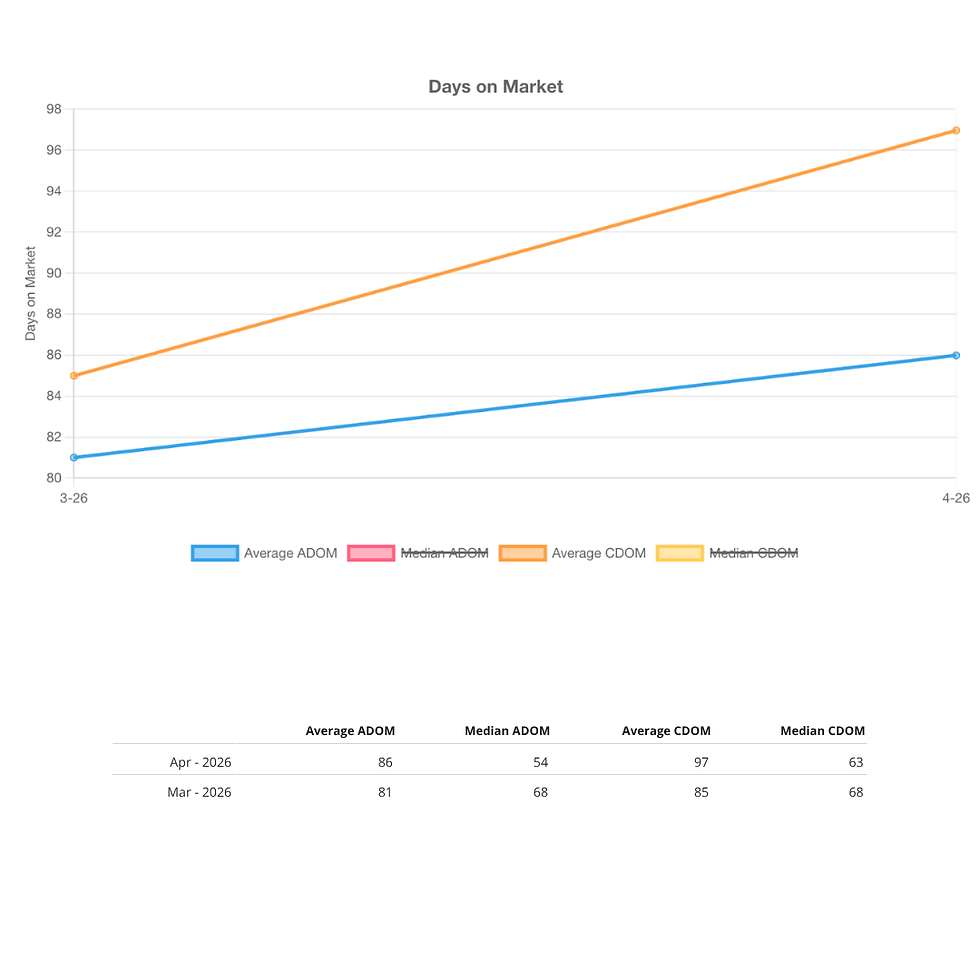
Days on Market: Homes Took Longer to Sell ⏱️
Average ADOM: 86 (up from 81)
Median ADOM: 54 (down from 68)
Average CDOM: 97 (up from 85)
Median CDOM: 63 (down from 68)
What this means:
On average, homes took longer to sell (average DOM and CDOM rose), but the median days on market improved—suggesting some homes are still moving relatively quickly while others are sitting longer. This is common when inventory increases: the best-positioned homes sell, and the rest require price adjustments or improved presentation.
Months of Inventory: Still Tight, But Rising 📈
Months of inventory: 3.39 (up from 2.84)
What this means:
Ocean Isle Beach is still relatively tight compared to many markets, but it’s loosening. Rising months of inventory typically means:
buyers have more leverage
sellers face more competition
pricing correctly from the start matters more

Ocean Isle Beach Volume: More Inventory Dollars + More Sold Dollars 📊
Active volume: $152,371,762 (up from $116,660,077)
New volume: $40,984,115 (down from $63,634,729)
Sold volume (list): $33,111,229 (up from $28,120,030)
Sold volume (sale): $31,971,050 (up from $27,465,690)
What this means:
There’s more inventory value on the market, and sold dollar volume increased—so buyers are still buying in Ocean Isle Beach real estate, but they’re taking their time and comparing options.

What This Means for Buyers in Ocean Isle Beach 🏡🌴
If you’re looking for:
➡️ Ocean Isle Beach NC homes for sale
➡️ Ocean Isle Beach condos for sale
➡️ Ocean Isle Beach beach houses
➡️ Second homes in Ocean Isle Beach
➡️ Ocean Isle Beach investment property
➡️ Vacation rental homes in Ocean Isle Beach NC
April 2026 offers more inventory and a market pace that can allow for negotiation—especially on homes that are overpriced or need updates.
What This Means for Sellers in Ocean Isle Beach 🏖️🔑
➡️ If you’re thinking about:
➡️ Selling a home in Ocean Isle Beach
➡️ Listing a beach house in Ocean Isle Beach NC
➡️ What is my Ocean Isle Beach home worth
➡️ How long does it take to sell in Ocean Isle Beach
This market can still reward sellers, but competition is up. The best results typically come from:
➡️ Pricing based on current comps + current competition
➡️ Strong photography and online marketing
➡️ Clear positioning (beach access, views, canal, mainland convenience, rental income potential, etc.)
Want a Personalized Ocean Isle Beach Home Value or Buying Plan? 📲🌊
Ocean Isle Beach values vary a lot by location (island vs. mainland), property type (condo vs. single-family), and rental potential. If you’d like a personalized breakdown of what these April 2026 stats mean for your home—or help building a smart buying strategy—reach out anytime. I’m happy to help you make a confident move in the Ocean Isle Beach, NC housing market. 😊
Contact me today at 910-518-JESS (5377) 📲 or email jess@jesswain.com 📧 to start your Ocean Isle Beach home selling journey. Let’s make your sale a splash! 🏖️💦✨
Download the Full Ocean Isle Beach Residential Market Summary for April 2026
Information is deemed to be reliable, but is not guaranteed. Data may have come from public tax records. © 2026 MLS and FBS. Prepared by Samantha A Talbott on Friday, May 1, 2026 8:51AM.


Comments