

Ocean Isle Beach Market Snapshot 📸 November 2025
- Jessica Wainwright

- Dec 15, 2025
- 3 min read
Ocean Isle Beach Real Estate Market Update – November 2025 🏖️📊
Thinking about selling your Ocean Isle Beach home? The latest market stats for November 2025 reveal a dynamic market with strong buyer demand, high sales volume, and competitive prices. If you want to maximize your return in the Ocean Isle Beach real estate market, now’s the time to get your home ready for listing! 🌊✨
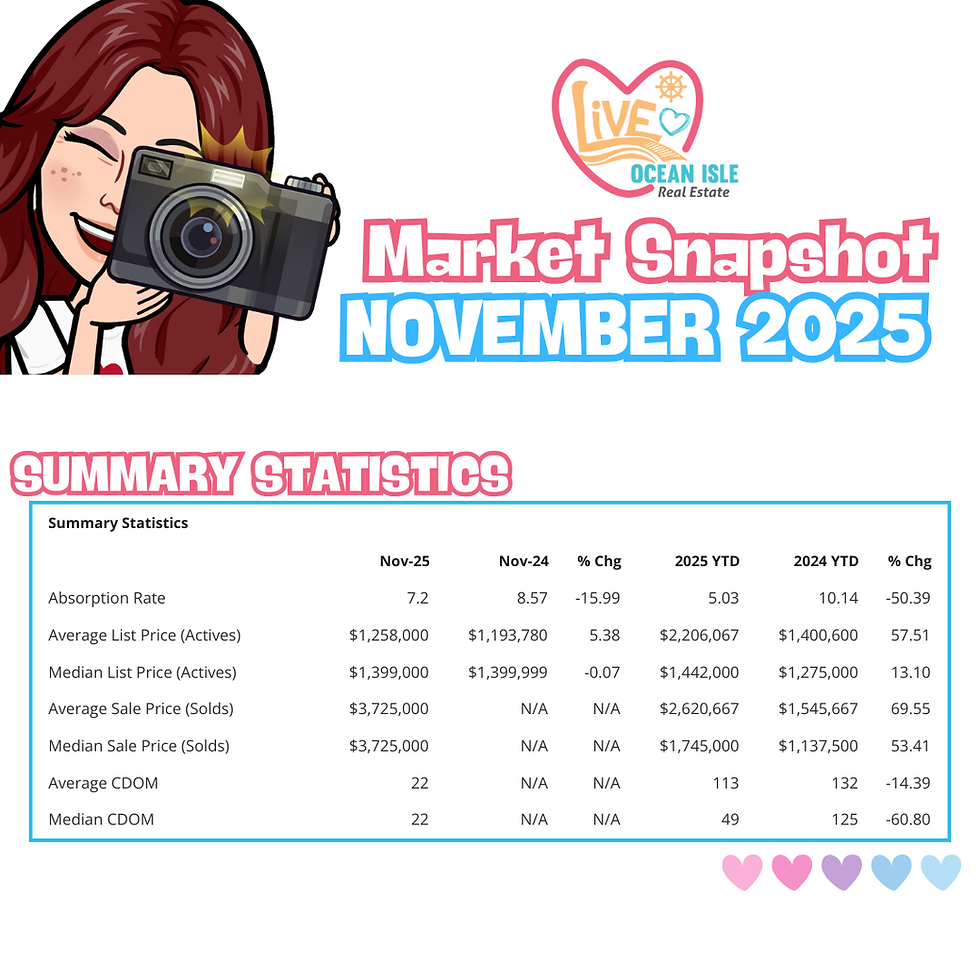
Pricing Trends – Steady and Strong ⏰
Active Average List Price: $719,251
Active Median List Price: $499,900
New Average List Price: $552,569
New Median List Price: $437,050
Sold Average Sale Price: $665,188 (up from $524,919 in Oct)
Sold Median Sale Price: $395,831
What this means: Ocean Isle Beach homes are commanding impressive sale prices, with the average sold price jumping over $140k month-over-month! Well-presented and competitively priced homes are attracting serious buyers and premium offers. 💰

Sale-to-List Price Ratios – Sellers’ Advantage 💰
Sale to Original List Price Ratio: 97.1% (steady from 97.3% in October)
Sale to Original List Price Ratio: 92.0% (up from 90.9%)
What this means: Homes are selling very close to their asking price, and sellers are keeping more of their equity. Pricing right from the start is key to maximizing your sale! 🎯

Pricing & Sales Trends – Strong Sale Prices 🏡
Active Listings: Rose from 163 in October to 197 in November
New Listings: 44 in November (down from 60 in October)
Pending Listings: 7 (down from 43)
Sold Listings: 66 in November (up from 44 in October)
What this means: More homes are available for buyers, but new inventory is slowing, and sales are surging. Sellers have a great opportunity to stand out as buyer interest remains strong! 🏡

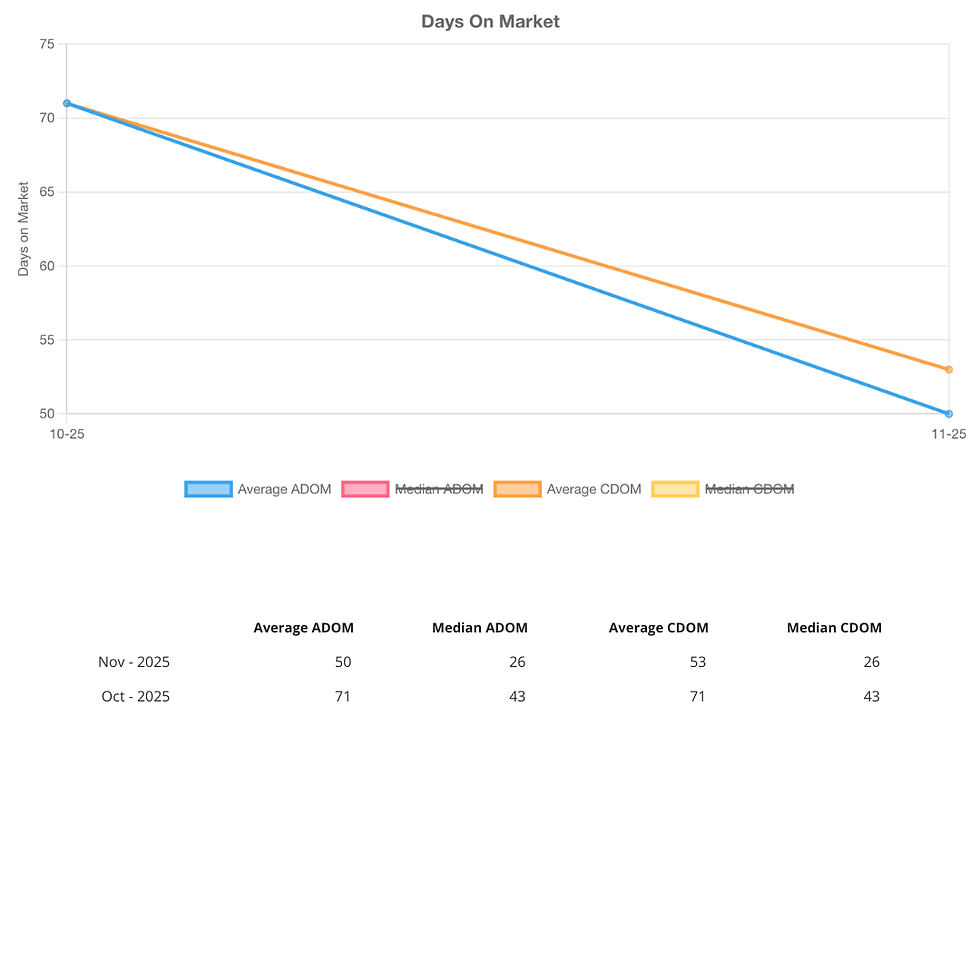
Days on Market – Homes Selling Faster ⏰
Average Days on Market (ADOM): 50 (down from 71)
Median Days on Market: 26 (down from 43)
Average/Median CDOM: 53/26 (down from 71/43)
What this means: Homes are selling much faster, with both average and median days on market dropping sharply. Motivated buyers are making quick decisions! ⏳
Months of Inventory – Tighter Market 📊
Months of Inventory: 2.98 (down from 3.70)
What this means: The market is moving toward a tighter supply, which is great for sellers—less competition and more buyer urgency.

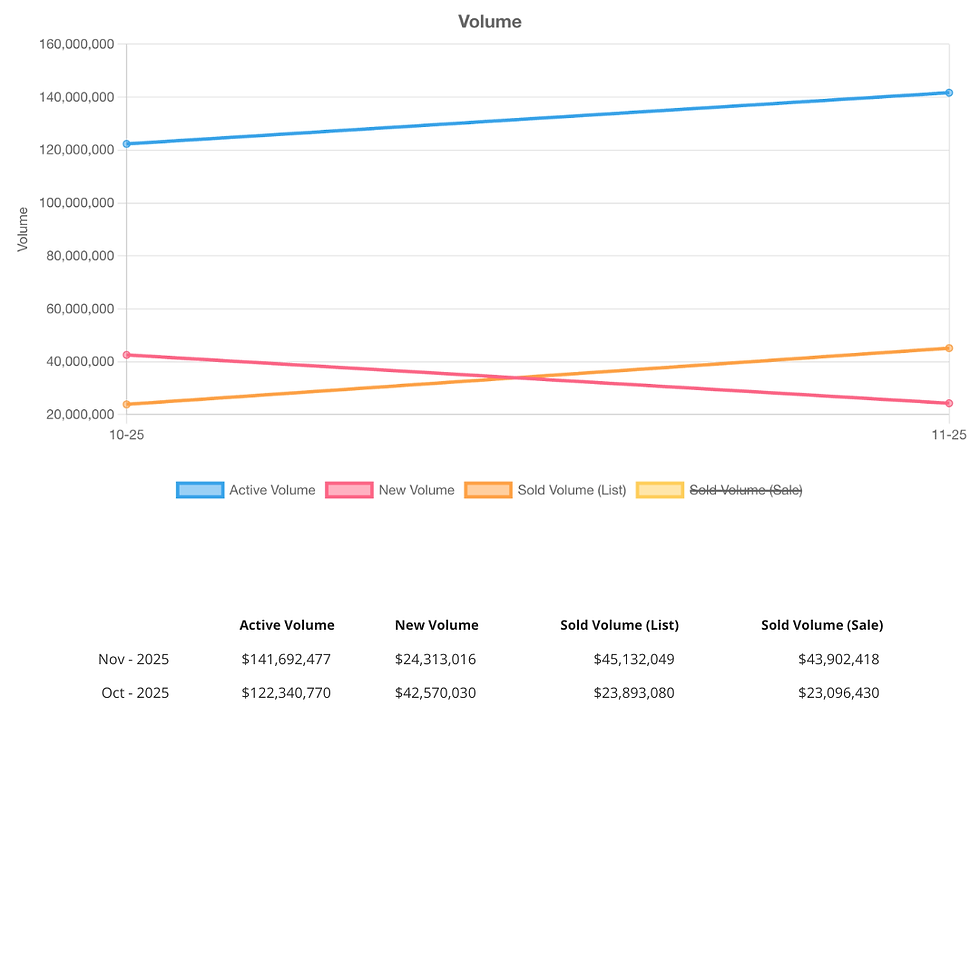
Market Volume – Huge Jump in Sales 💼
Active Volume: $141,692,477 (up from $122,340,770)
Sold Volume (Sale): $43,902,418 (up from $23,096,430)
What this means: Ocean Isle Beach is seeing a surge in total sales volume, reflecting high demand and strong buyer activity. 📈
What Does This Mean for Ocean Isle Beach Sellers? 🌟
Sales are up and days on market are down: Homes are moving quickly and for strong prices.
Inventory is higher, but new listings are slowing: Your home will get more attention from motivated buyers.
Sale prices are up: The average sold price jumped by over $140,000 in one month!
Sellers are getting top dollar: With sale-to-list ratios at 97%+, you can expect to keep more equity.
Whether you’re selling a beach cottage, canal-front home, or investment property, the Ocean Isle Beach real estate market is primed for sellers looking to make a move this season. 🏝️
Ready to List Your Ocean Isle Beach Home? Let’s Chat!
If you’ve been thinking about selling your Ocean Isle Beach property, now’s the time to take advantage of these positive regional trends. We can help you price, market, and sell your home for top dollar—quickly and stress-free! 😊
Contact me today at 910-518-JESS (5377) 📲 or email jess@jesswain.com 📧 to start your Ocean Isle Beach home selling journey. Let’s make your sale a splash! 🏖️💦✨
Download the Full Ocean Isle Beach Residential Market Summary for November 2025
Information is deemed to be reliable, but is not guaranteed. Data may have come from public tax records. © 2025 MLS and FBS. Prepared by Samantha A Talbott on Monday, December 1, 2025 8:45AM.


Comments